Stracker User Guide
Analysis Tool of MEASURE Platform
It is important to note upfront that this is the description of the first version of the tool. There will be a new major version released in May 2019, that will contain many improvements both from front- and back-end point of view.
Stracker can be used on a stand-alone basis, but also integrated into the MEASURE platform, which can analyze stored metrics by communicating through APIs with the other components of the platform.
Stracker is a web application whose goal is to increase the quality of software development by tracking and suggesting values for numerous software metrics during the development process. Specifically, it helps to verify metric values using various graphical representations and provides scores for each new record. It also includes a module predicting future metrics based on the historical values recorded so far.
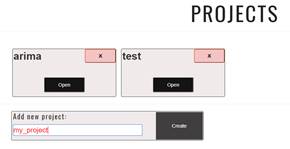
To create a new project or to enter an existing project in the menu, click on the Projects tag.
On the new page, go down to the Add new project box and write the name of the project that we want to start with. The name must be the same as the name of the project that we import from SonarQube.
For prediction, we give two examples:
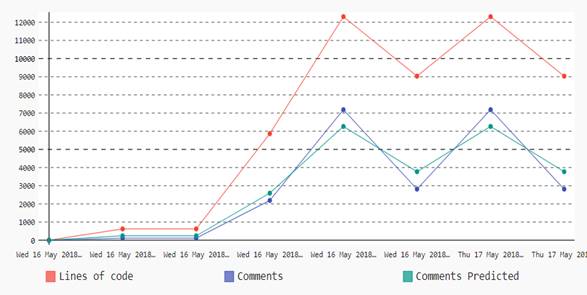
- The red line shows the total number of project code lines
- The blue line shows the total number of comment lines of the project
- The green line shows the prediction of the number of draft comments lines
For this metric, the goal is to make the difference between the blue line and the green line as small as possible, i.e., the number of comment lines of the project being as close as possible to the number of predicted comment lines using regression algorithms.
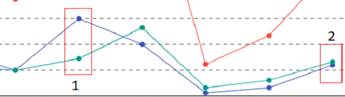
In the first case (1), the metric value is smaller than in (2) where the metric value and the predicted value are almost similar.
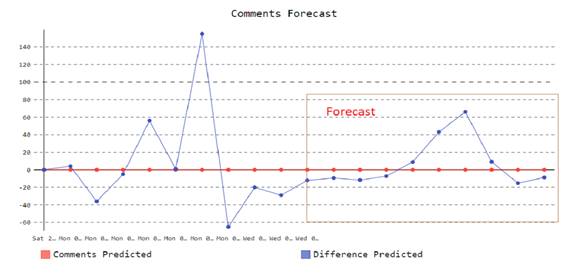
Another type of output graphics:
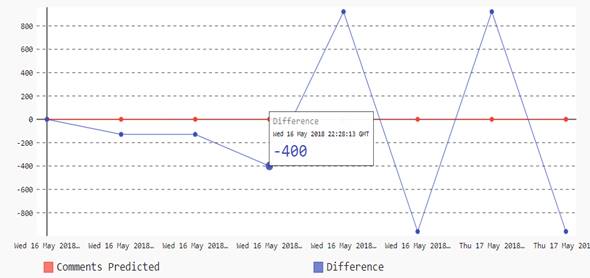
Here you can see the difference between the number of comment lines of the project and the number of predicted comment lines.
If we hover over a point, we can see the exact metric at that point. After each new record we can see if the new metric values are better than the values of the previous record, checking the score. To see the score, click the Track tag and go to the Score section.
Current score is the current record score, calculated based on the difference between our metric value and the predicted value. Last Score is the penultimate recording added (the one before the current record)
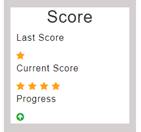 We say that progress is
positive, if the current score is better than last score and negative
otherwise.
We say that progress is
positive, if the current score is better than last score and negative
otherwise.
Ideally, each measurement should be better than the previous one. If we get a small score for a certain metric, we can track the metrics that led to that score in the two graphs and try to bring those values as close as possible to the predictions made by the app.
 For each metric
suggestion, the score is calculated differently. For example, if for no. of
lines metric, the score is better as the value approaches the predicted value,
for the (violations - minor violations) metric, the number of minor violations
must exceed the predicted limit as much as possible because a
large number of them reduce the number of major, critical, or blocking
violations.
For each metric
suggestion, the score is calculated differently. For example, if for no. of
lines metric, the score is better as the value approaches the predicted value,
for the (violations - minor violations) metric, the number of minor violations
must exceed the predicted limit as much as possible because a
large number of them reduce the number of major, critical, or blocking
violations.
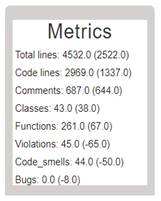
In the Metrics section, you can see the numeric values of the metrics as well as the difference from the last record.
For example, the picture shows that the project now contains 4532 lines, with 2522 more than the previous measured record. In the case of the code metrics the code smells metric, the number decreased by 50, reaching 44.
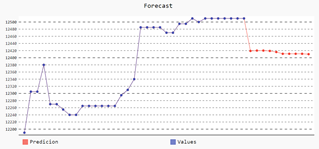
If we press the Forecasting tag, we can see a graph of the
predicted values for our metrics. The classic algorithm ARIMA was used for
forecasting.
For an efficient prediction, the number of historical data on which to calculate future data values should be as large as possible.
 Last
but not least, Stracker
awakened the interest of the other partners such as Softeam
and Bitdefender. For example, Softeam wanted to get
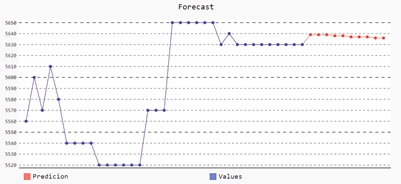
certain metric forecasting. The figures below show the data forecasted by Stracker based on production data for Softeam.
Last
but not least, Stracker
awakened the interest of the other partners such as Softeam
and Bitdefender. For example, Softeam wanted to get
certain metric forecasting. The figures below show the data forecasted by Stracker based on production data for Softeam.
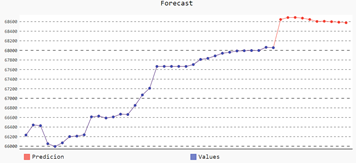
Forecasting
for an architectural metric
Forecasting for a bug remediation effort metric
Forecasting for a security metric